10 Ideas to Improve KPI Reporting
10 Ideas to Improve KPI Reporting
Today’s businesses that want to succeed rely more and more on key performance indicators, or KPI, to assess the effectiveness and development of their primary strategy. When used with benchmarks, a precise set of KPIs can reveal practically everything about a given strategy, including how it performs, which specific components may be failing or succeeding, and the effectiveness of the plan’s implementation.
However, there is a drawback: KPIs aren’t very understandable.
Raw data processing and understanding are not human beings’ most vital natural abilities. Our ability to see and respond to the world is founded on the information we acquire and analyze from our senses.
Because of this, we typically find it far simpler to understand visuals, tales, and other abstract presentations than plain data. What steps can you take to improve the usability of KPI reporting for your workers and potential clients?
How to Report KPIs in a More Intuitive Way
These are some of the most successful methods for increasing KPI reporting and making it more efficient.
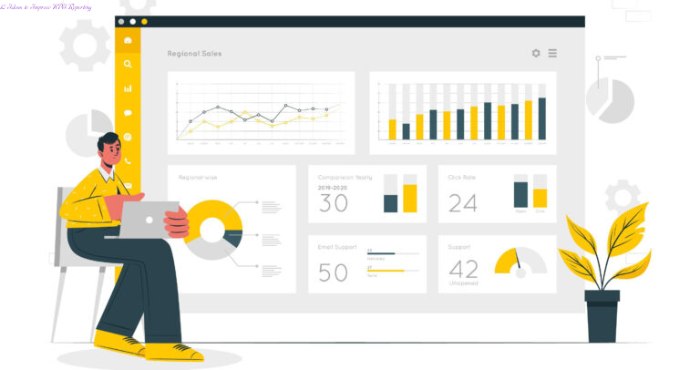
- Dashboard. Consider first improving the dashboard. Most individuals use a centralized control panel to gather and display all the relevant data points for measuring and analyzing KPIs. You’ll be in a much better position to draw essential conclusions in less time if you can customize it to display the essential information and present the data points so that most people can understand at a glance.
- Streamline reporting. You can automate reports as well. Everyone who receives a report will eventually become skilled at seeing the most significant trends in the data if you establish a report template and utilize automation to distribute it frequently. Although this takes time, the uniformity in data interpretation and staff comprehension should be astounding.
- Give precise definitions. Always spend time defining your KPIs and the key factors that affect them. This is crucial if you intend to share the information with non-experts in data analytics.
- Give instances. Giving the people who receive your report examples is even better. It’s one thing to display the percentages for your website’s bounce and exit rates. Still, it’s best to explain the differences and provide specific examples of the users that influenced those figures.
- Use pictures. Technically, data visualization has existed for centuries; the earliest documented statistical graph appeared in 1644. Even before that, there were undoubtedly visual representations of data. However, it hasn’t until recently that data visualization has developed to a point where it is practically available to everyone. Even though they can hide outliers and distort some variables, visuals generally make data analysis more understandable and accessible.
- Narrate a tale. You could also write a story. Compared to simple data points or visually appealing graphs and charts, people react considerably more favorably to stories with an arc. Your KPIs will immediately become more legible and logical with a bit of imagination.
- Limit the scope. Data overload can easily be harmful to people. Try reducing the scope if your report’s information is too complex for readers to understand. For a straightforward illustration, provide the top 5 or 6 KPIs rather than reporting on 50 KPIs.
- Compare like with like. Always strive to compare apples to apples when running reports. Comparing a KPI to where it was one month prior is considerably more helpful than comparing it to an entirely different KPI.
- Know your target market. Keep your audience in mind at all times when presenting the info. People knowledgeable about data analytics don’t need as much training as those who have never heard of a KPI. The people who require it should always have more context and support available.
- Obtain feedback and act on it. Feedback from both parties improves everyone. Ask your audience what they think of your presentation and whether there is anything you can do to make it more accessible if you want to achieve more intuitive KPI reporting. Act on the feedback if it makes sense.
KPIs Don’t Always Matter
One more thing: KPIs aren’t everything. It is true that data-driven businesses typically outperform those that rely on gut instinct, so if you want to remain competitive, data should be a key component of your strategy.
However, KPIs can become your exclusive focus if you take this path too far. No matter how advanced our analytics get, we’ll never be perfect in data use.
To advance your operations, you must measure and analyze KPIs, widen the scope of your analysis, use creativity, and consider the factors that make us human.
Also read:-Four Reasons Why Your Company Ought To Create Its Software.